BroadPaper Cloud
Recurring client reports, without the recurring work.
Bring the spreadsheet you already keep. BroadPaper works out what its columns mean, fills in a report you designed once, and makes a finished, branded PDF for every client — this month, and next month again from the new figures.
Free to start, no card. Pro is $59 a month, billed in US dollars.
New Describe the report you want, and the design assistant drafts it. How it works
- Client namethe client
- Nameeach holding
- Valueeach value, and the total
- Shareeach share
- 32 clientsone report each
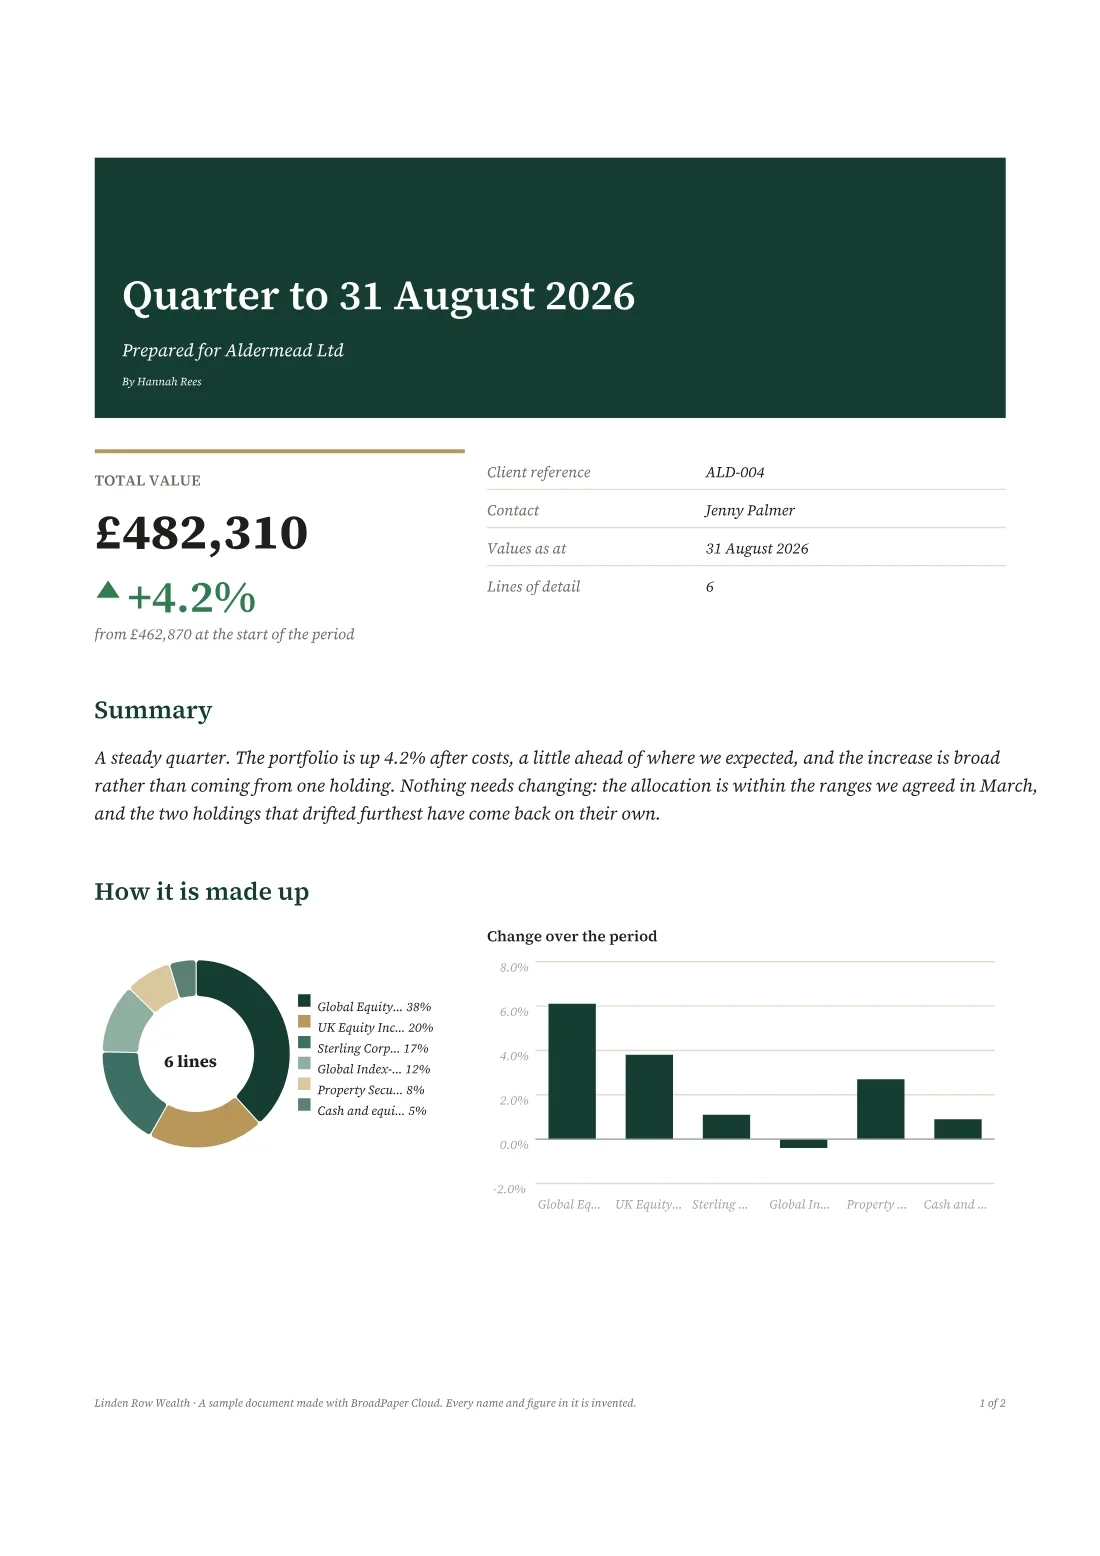 × 32
× 32 The same report, built again by hand, for every client, every month.
Without BroadPaper
- Open last month's report and save a copy
- Paste in this month's figures, a cell at a time
- Rebuild the table and redraw the chart
- Fix the page that now breaks through the table
- Check nothing of the last client's is left in it
- Save as PDF
- Start again for the next client
× 32
With BroadPaper
- Bring in this month's spreadsheet — or press Refresh, if it lives in Google Drive or OneDrive
- Look over a report or two on screen
- Make the documents: a file per client, or one to print
Designing the report is the part you do once.
Nobody wants to map fields.
Other tools begin by making you wire data to document: this column is the client, that one the amount. It is the step people give up on, and BroadPaper does it for you.
It reads your headings and the values under them, and asks only where it genuinely cannot tell — with your own figures beside each choice, because £482,310 is quicker to recognise than portfolio_current_value. Anything it decided, you can change.
BroadPaper matched 13 of 14 fields. One needs your eye.
Three columns could be this one. Which should the document show?
- Portfolio Total£482,310
- Current Value£481,992
- Assets£490,100
Matched to Customer Name — for example, Aldermead Ltd.
Use a different column
Design it once. Make it every month.
A design remembers which column is which. Next month, bring in the new spreadsheet and point the design at it, or press Refresh if the file is in Google Drive or OneDrive, and every report fills in from the new figures.
One spreadsheet with every client in it becomes a report each. BroadPaper notices, asks, then offers:
- 32 separate files, each named after its client — to send
- All of them in one file — to print or to file
- Just the one on screen — to check first
Each separate file is one of the month's documents; Pro makes 500 a month. How recurring reports work
A document you would put your name on.
BroadPaper decides every page break itself, so the pages you approve on screen are the pages your client gets.
- Real pages. A table that runs on carries its headings to the next page. Nothing is cut in half.
- Vector type. Text stays text: searchable, selectable, sharp on screen and on paper.
- Page numbers that are right, on every page of every client's report.
- The same every time. Same design, new data, next month. Nothing drifts.
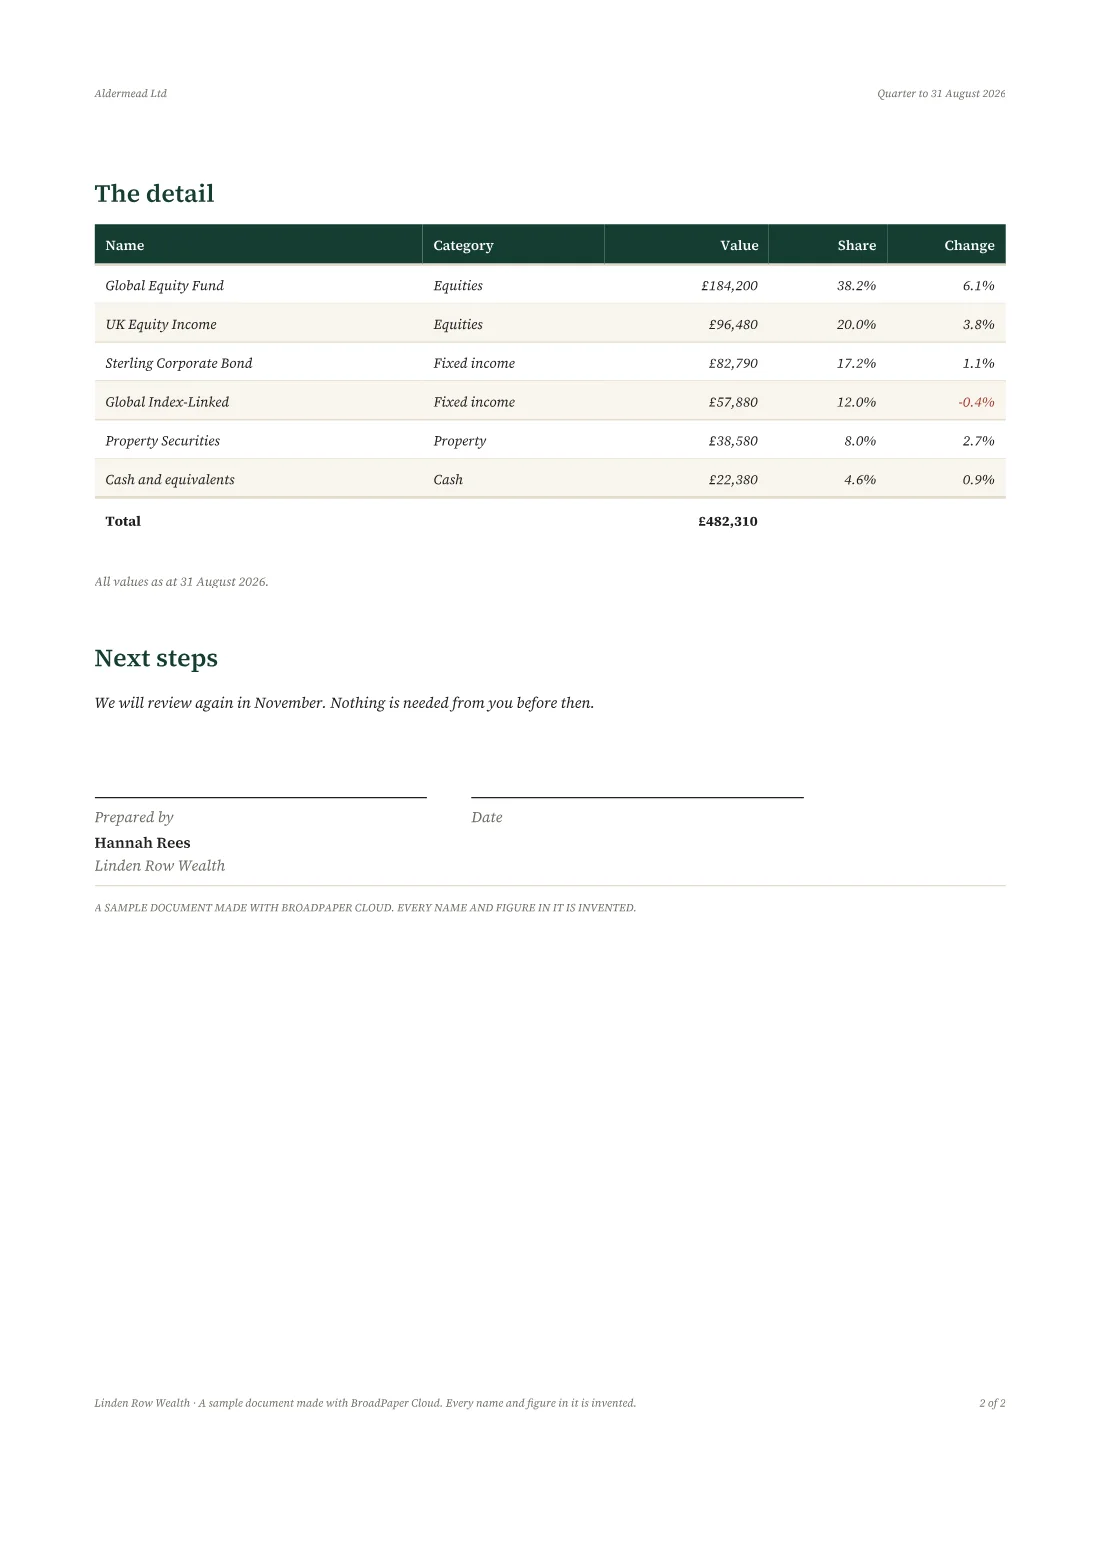
Describe the report. Check it. Keep it.
Type what the report should be — or what to change about the one in front of you — and the design assistant drafts it. Nothing changes until you have seen it.
- A draft, not a decision. You see the new design and a list of what changed, then accept it or discard it. Accepted, it is one step to undo.
- Built from your columns. It uses the fields your spreadsheet actually has; a draft that names one it doesn't never reaches you.
- Your figures stay out of it. It is sent your words, the design and your column names — never the values in your data. Making the documents involves no AI at all.
- On both plans. About 7 drafts a month on Free, about 97 on Pro.
Add the holdings as a table with a total at the foot, put an allocation chart beside it, and make the headings navy.
116 / 2,000Proposed changes 3
- Added a table to “Holdings”
- Added a chart beside it
- Changed the heading colour to navy
The table and the chart use your columns “Holding”, “Asset class” and “Value”. Nothing else in the report was touched.
Start from a finished report.
Real documents with sample data already in them. Put your own data behind one and change whatever you like.
-
Client report
-
Monthly report
-
Market commentary
-
Statement
-
Certificate
-
Invoice
Also quote, receipt, pro forma invoice, credit note, delivery note and purchase order — all 12 on both plans.
And the rest of the job.
-
Excel, CSV or JSON
Drop a file in, paste rows, or type them into a grid.
-
Google Drive and OneDrive
Pick the file where it lives. Next month, press Refresh.
-
Your letterhead
Your details, logo and colour, typed once, on every design.
-
Start from the report you send nowPro
Turn a Word document or PDF into a design you can refill.
-
Every earlier version
Each version says in plain words what changed.
-
Colleagues and share links
Up to 20 people in a workspace; links with an expiry or a password.
For teams that send the same document to a lot of clients.
Where it doesn't: the odd invoice. Your accounting software already does that well.
- Financial advisers and wealth managersQuarterly valuations and reviews, one per client.
- Accountants and bookkeepersMonthly summaries and statements for every client.
- Consultancies and professional servicesStatus reports, KPI packs, the monthly summary.
- AgenciesA performance report per retained client, in your branding.
- Operations and reporting teamsThe monthly numbers, as a document people read.
- Membership bodies and training providersCertificates and statements, hundreds at a time.
Your clients' figures, handled with care.
-
Read in your browser
Your spreadsheet is opened in the tab. The file itself is never uploaded.
-
Stored in your workspace, in the UK
The columns and rows read from it are kept there, because that is where reports are made. Only your workspace sees them.
-
Shared only when you share
A report leaves as a file you download or a share link you can stop. Nothing is used to train anything.
Exactly what is kept, and for how long, and the privacy policy.
Free to start. One plan when it's part of the job.
Free is the whole product with your own data, up to 10 documents a month with a small BroadPaper line at the foot of each page. Pro removes the line and makes room for every client: 500 documents a month and 50,000 rows per spreadsheet.
Made by Barry Mooring
BroadPaper is designed, built and supported by Barry Mooring, through Codingbadger Creative Limited in West Sussex. Write to support@broadpaper.com and the person who built it replies.
Building software? The same document engine is available as an SDK for React and Angular. For developers